Have any questions? Email: info@flynet.email. US: +1 617-778-7259. UK: +44 (0)3333-110-370. ES/PT: +351-300-500-441.

Examples
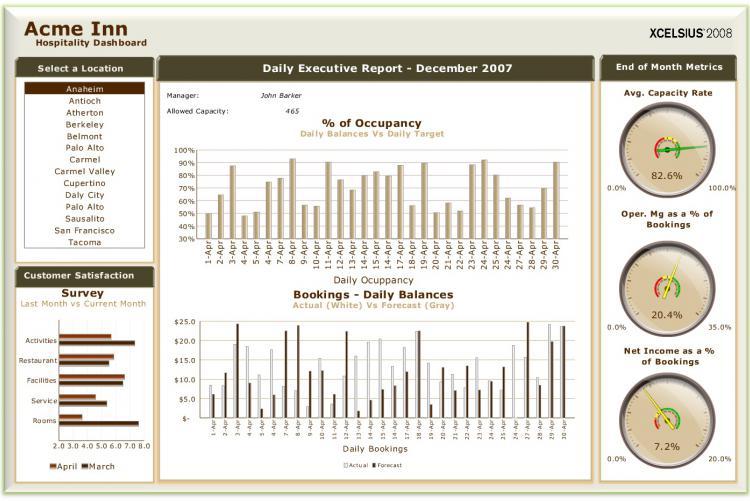
This hospitality dashboard enables executives to evaluate regional performace, resources, and customer satisfaction on a daily basis.
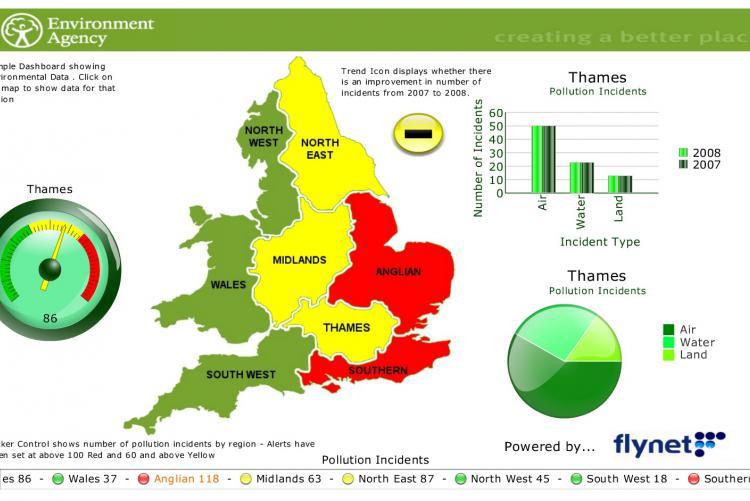
The environment agency publish detailed statistics for each county in the UK. These are ideally presented using dashboards, where measurements and trends can be accessed visually using a map.
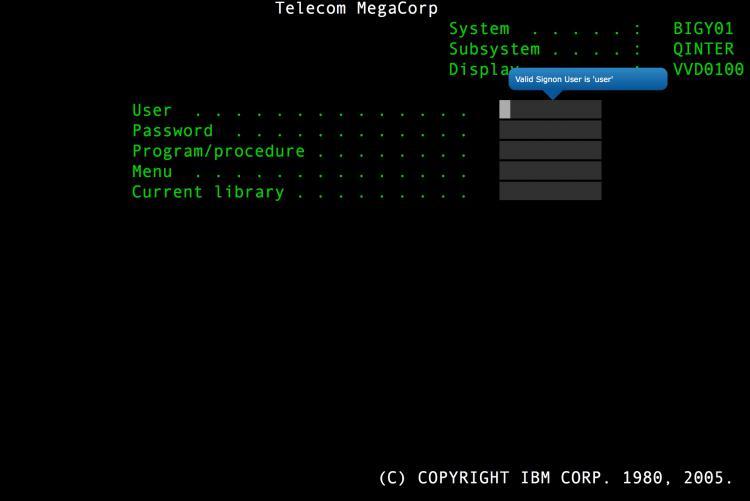
The Flynet Viewer browser based terminal emulator works using HTML and standard in-browser scripting (JavaScript). There is no need to use Java applets or Microsoft ActiveX controls. Point your browser at the Flynet Viewer URL and away you go.
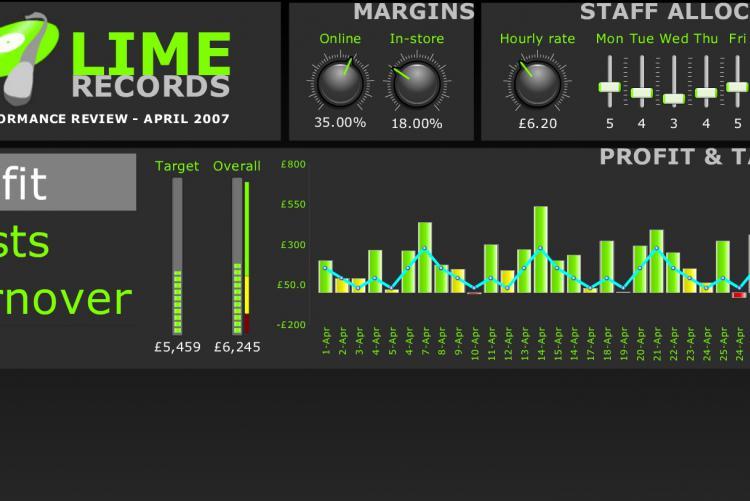
Sales volumes and turnover for this national media retailer can be viewed by county, city, genre and format in this dashboard.
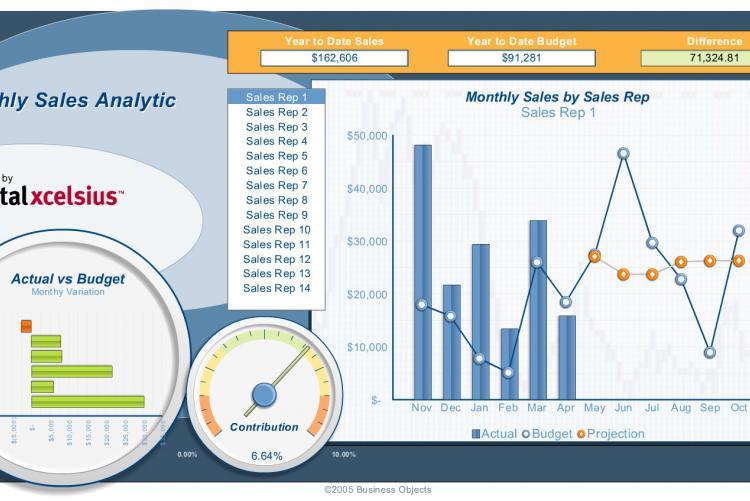
Performance of individual sales reps can be monitored, and compared with targets.
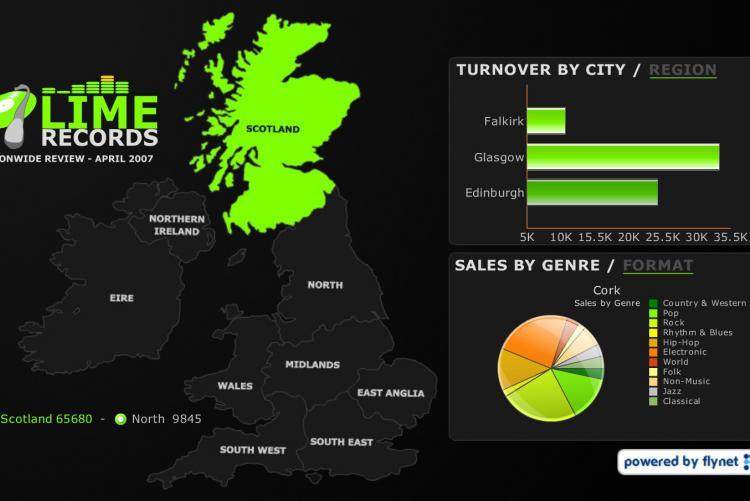
Sales volumes and turnover for this national media retailer can be viewed by county, city, genre and format in this dashboard.
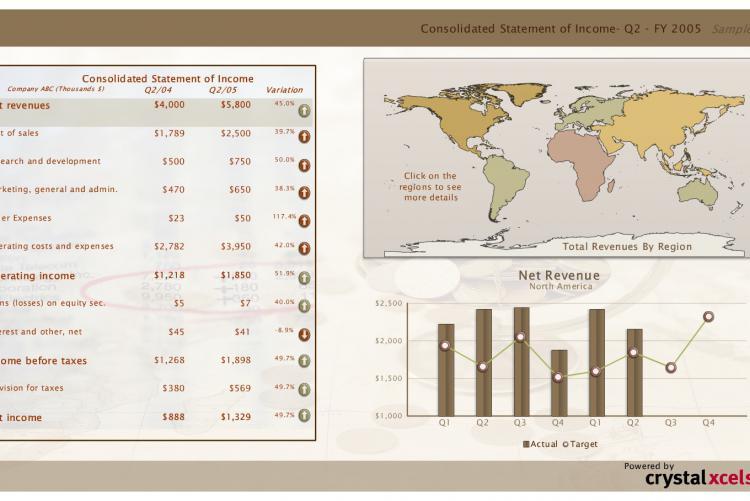
This dashboard breaks down operating costs and projections over six continents.
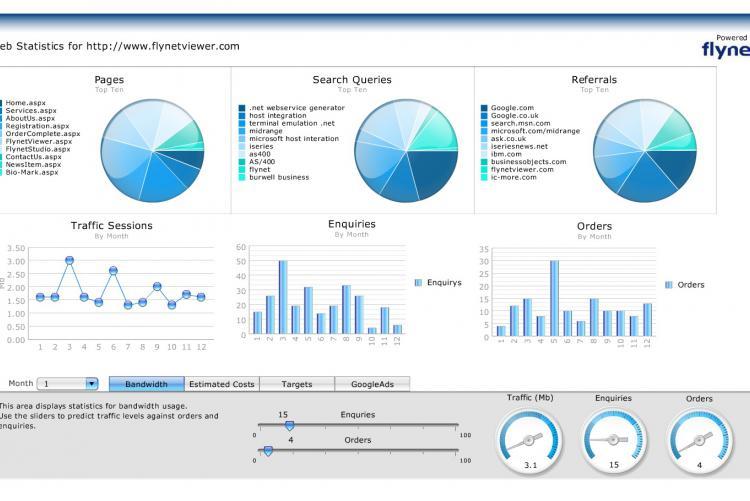
This web statistics dashboard allows the user to project different scenarios dynamically, based on data already collected. For example, increasing the number of Internet enquiries will produce an increase in bandwidth costs.
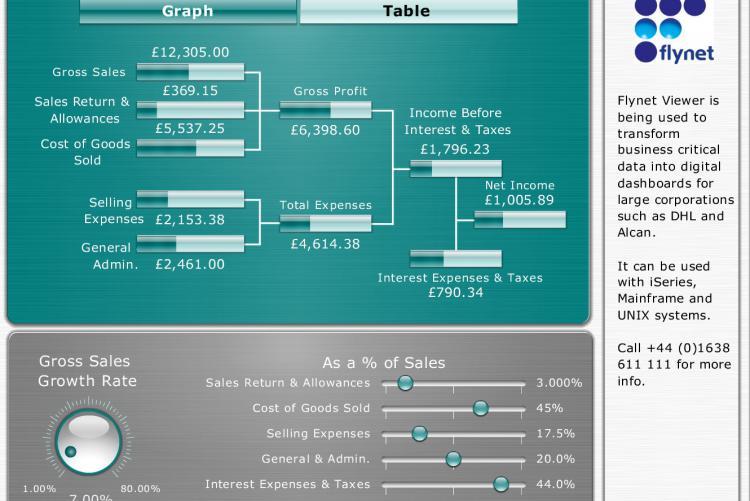
This dashboard shows how by adjusting values for a range of variables, different business scenarios can be forecasted.